Climate Analyzer.org
Research Associate: Mike Tercek
Project overview: I created ClimateAnalyzer.org (an NRCC – National Park Service collaboration) to make obtaining and analyzing weather station data from National Parks easy.
Backstory: Weather station data is usually hard to understand. If you download it from one of the official sources, like the National Weather Service, it often looks like computer code rather than a weather summary. Even if it does arrive in a simple table, it isn’t easy to look at long-term trends, calculate averages, or extract drought information. ClimateAnalyzer.org makes it easy to obtain and understand weather data from the National Parks.
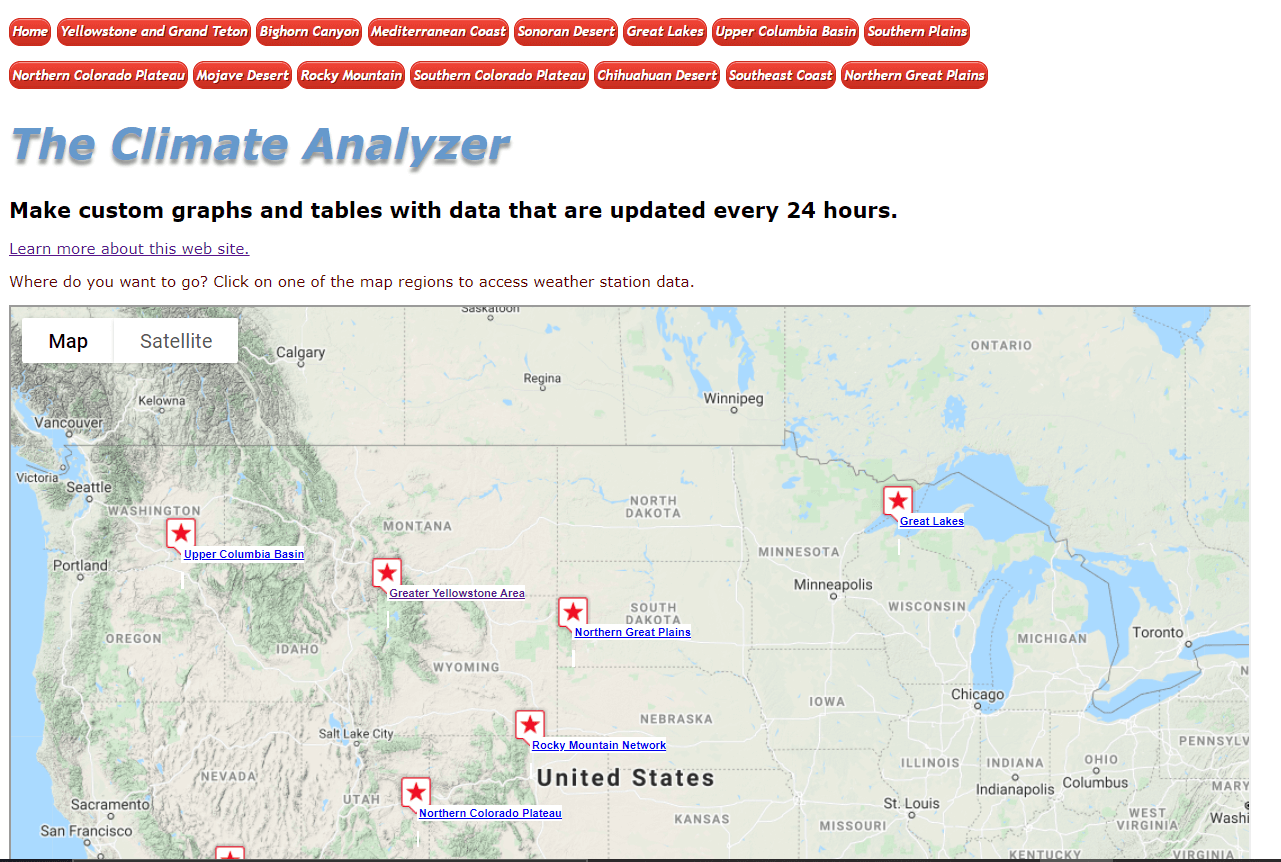
There are two different interfaces to the website. The first, popular science interface is a “climate dashboard.” It provides the most popular and relevant “real time,” up-to-the-minute graphs and tables for a national park like Yellowstone with just a few mouse clicks. The dashboard for Yellowstone National Park is located at http://www.ClimateAnalyzer.org/y_dash (Figure 1).
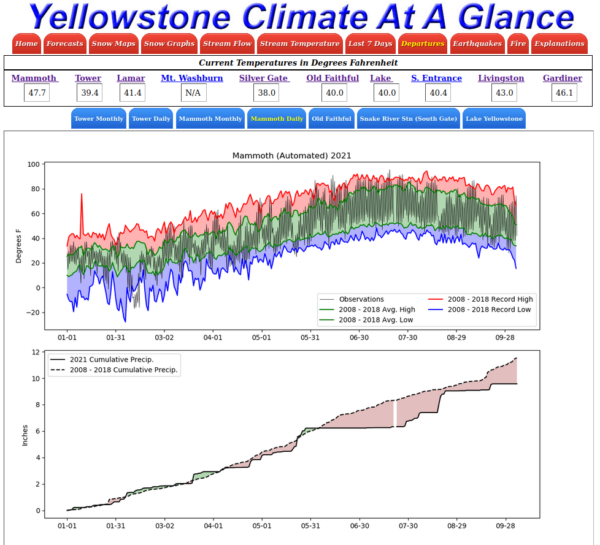
Figure 1. Screenshot of the Yellowstone Climate Dashboard (http://www.climateanalyzer.org).
The second interface, which is available from the front page of the web site (http://www.climateanalyzer.org), allows people to make detailed data queries and advanced graphs. Do you want to know what the high temperature was on January 1, 1897? Maybe you’d rather calculate the average length of “dry spells” (number of days between rain events) during every year since 1900 at Mammoth or Old Faithful? . . . or look at long-term trends in peak snowpack? . . . or compare the average hydrographs from a stream gauge during two time periods? There are hundreds of possibilities available with just a few mouse clicks. It’s easy to find interesting patterns like the one shown in Figure 2.
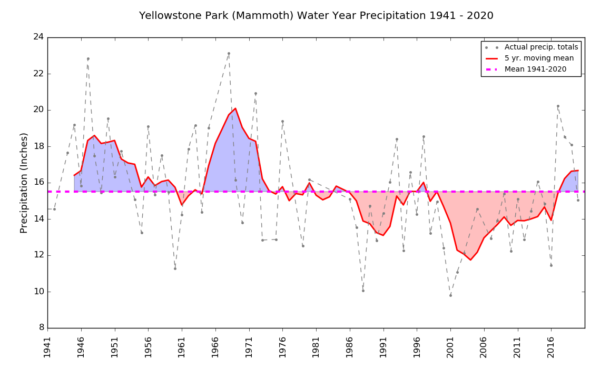
Figure 2. Annual precipitation in Yellowstone National Park 1941 – 2020. Red-shaded areas show years where the 5-year moving average is below the 1941 – 2020 average. Blue areas show years with the moving average above the long-term mean. Graph generated with a few mouse clicks on ClimateAnalyzer.org.
Current Status: There are currently 20 data sources included on the website. These include NWS COOP stations, RAWS, USGS stream gauges, Canadian Weather stations, SNOTEL, HADS, USBR lake gauges, USGS earthquake data, SNODAS satellite imagery, Drought Monitor, marine buoys, NWS Forecasts, and a variety of other rain gauges, and NPS constructed collection platforms. Data from all these sources are updated at least every 24 hours. Some datasets are updated hourly or even every 15 minutes.
The interactive long-term and real-time data on ClimateAnalyzer.org is invaluable for understanding and planning for human needs and vegetative and wildlife conservation. We encourage you to share how you are using the data and if you have ideas about how we can improve the site.
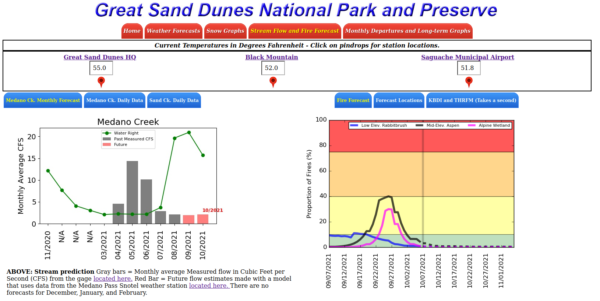
Recently we have been adding nowcasts and forecasts that use statistical relationships between climate data and resource conditions. For example in Great Sand Dunes National Park we estimate current fire danger both for the current day and 30 days in advance. The web page, with an explanation of methods is here. A screenshot is below.
Project Partners: NPS
Project start year: 2011